 code前端网
Python 数据可视化教程:设置注释、图例和图表背景的样式
使用图表库中的适当方法可以进一步设置在 Python 中创建的图表的样式。在本课中,我们将看到注释、图例和图表背景的实现。我们将继续使用上一章中的代码并对其进行修改以将这些样式添加到图表中。
添加注释
很多时候我们需要通过突出显示图表上的特定位置来注释图表。在下面的示例中,我们通过向这些点添加注释来指示图表值的急剧变化。
import numpy as np
from matplotlib import pyplot as plt

x = np.arange(0,10)
y = x ^ 2
z = x ^ 3
t = x ^ 4
# Labeling the Axes and Title
plt.title("Graph Drawing")
plt.xlabel("Time")
plt.ylabel("Distance")
plt.plot(x,y)

#Annotate
plt.annotate(xy=[2,1], s='Second Entry')
plt.annotate(xy=[4,6], s='Third Entry')
运行上面的示例代码,你会得到以下结果 -
![]()
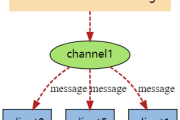
添加图例描述
有时你需要绘制多线图。图例的使用表明了每行的含义。下表有3相应的图例。
import numpy as np
from matplotlib import pyplot as plt

x = np.arange(0,10)
y = x ^ 2
z = x ^ 3
t = x ^ 4
# Labeling the Axes and Title
plt.title("Graph Drawing")
plt.xlabel("Time")
plt.ylabel("Distance")
plt.plot(x,y)

#Annotate
plt.annotate(xy=[2,1], s='Second Entry')
plt.annotate(xy=[4,6], s='Third Entry')
# Adding Legends
plt.plot(x,z)
plt.plot(x,t)
plt.legend(['Race1', 'Race2','Race3'], loc=4)
运行上面的示例代码,您将得到以下结果 -
![]()
图表显示样式
在样式包中,您可以使用不同的方法来更改图表显示样式。
import numpy as np
from matplotlib import pyplot as plt

x = np.arange(0,10)
y = x ^ 2
z = x ^ 3
t = x ^ 4
# Labeling the Axes and Title
plt.title("Graph Drawing")
plt.xlabel("Time")
plt.ylabel("Distance")
plt.plot(x,y)

#Annotate
plt.annotate(xy=[2,1], s='Second Entry')
plt.annotate(xy=[4,6], s='Third Entry')
# Adding Legends
plt.plot(x,z)
plt.plot(x,t)
plt.legend(['Race1', 'Race2','Race3'], loc=4)

#Style the background
plt.style.use('fast')
plt.plot(x,z)
运行上面的示例代码,得到以下结果 -
![]()
版权声明
本文仅代表作者观点,不代表Code前端网立场。
本文系作者Code前端网发表,如需转载,请注明页面地址。
相关文章


作者文章
- 用小程序学英语到底有没有用?适合哪些人?避坑指南加靠谱用法有吗? 4周前 (05-22)
- 2024-2025做通用和本地生活小程序没人看没人下单怎么办?试试这6个小成本留客转化型技巧 4周前 (05-22)
- 做小程序英文翻译避不开哪些坑?怎么翻才能吸引海外用户留存? 4周前 (05-21)
- Vue3 Composition API watch开启deep后踩过哪些坑?如何高效用它处理深层数据监听? 4周前 (05-19)
- Vue3中watch监听props时,deep:true到底该不该随便开? 4周前 (05-19)